Stage 20
This step finally extracts the spectra!
A new Stage 20 workdir is created:
stage20/s20_run_YYYY-MM-DD_HH-MM-SS
The extracted light curves and spectra are saved in:
stage20/s20_run_*/extracted_lc
PACMAN uses optimal extraction to extract the spectra.
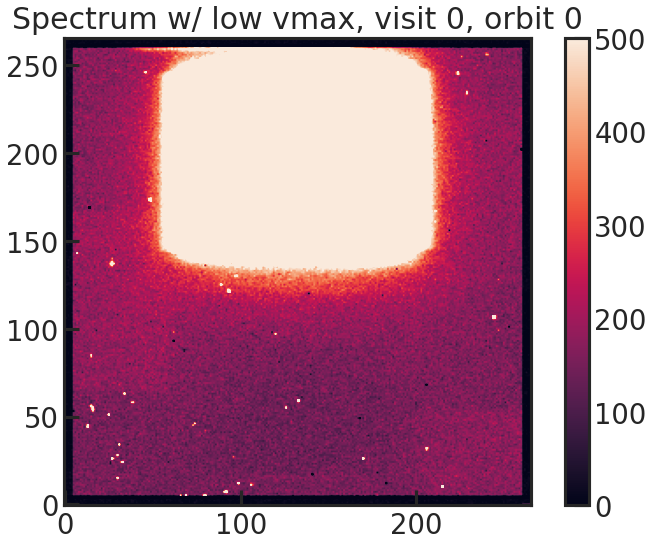
This effectively converts these 2D spectra:
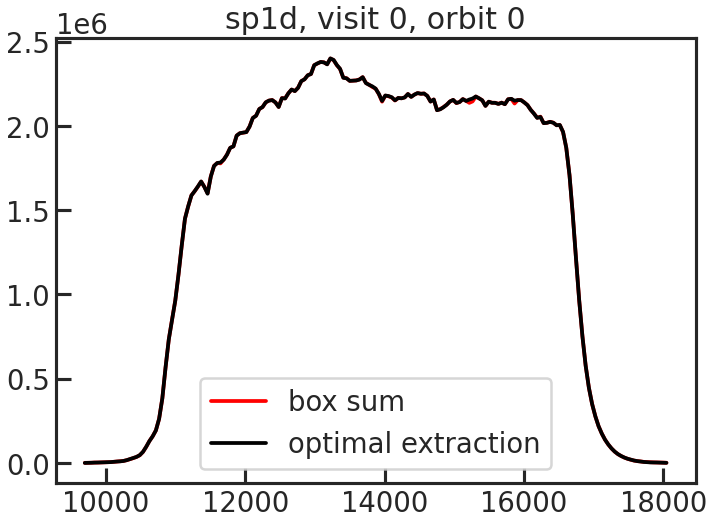
Into 1D spectra:
The way PACMAN determines the rows which should be used in optimal extraction can be seen in the following plot:
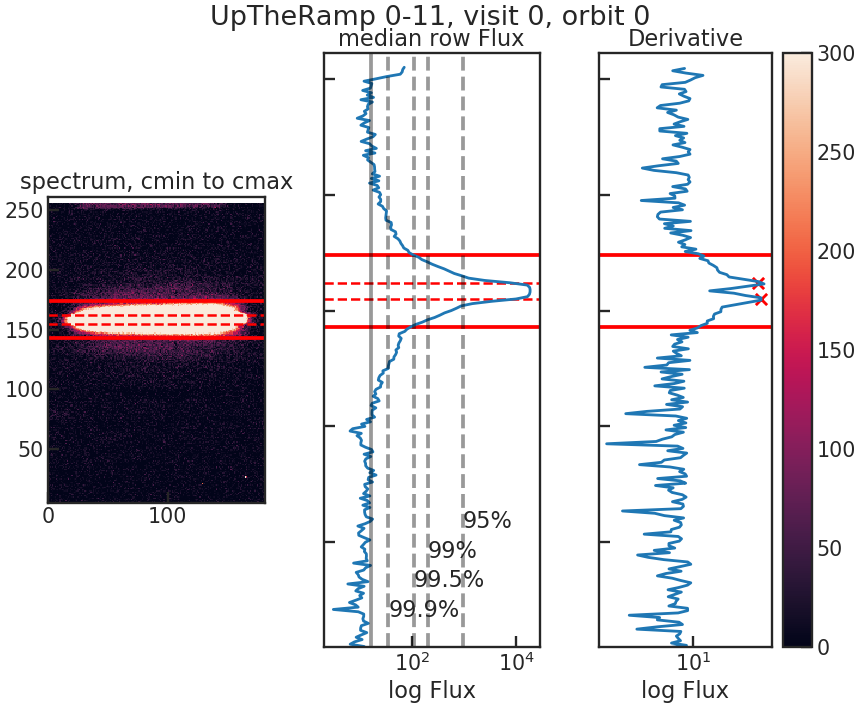
The first panel (left) shows the 2D spectrum. The column limits are determined using the trace.
The second panel (middle) shows the median flux in every column.
The third panel (right) shows the absolute difference between the median flux in the adjacent columns. We use these two rows where the flux changes the most as reference rows. The pcf file contains a window parameter. If the two determined peaks are at row=155 & row = 162 and window was set to 12, the data between rows 155-12 and 162+12 will be used in the optimal extraction.
When running Stage 20 you will see an output similar to the following:
    Starting s20
        Using Stage 10 input directory: ...
Location of the new Stage 20 run directory: ...
    in total #visits, #orbits: (3, 12)

    ***************** Looping over files:   0%|          | 0/225 [00:00<?, ?it/s]
    Filename: /home/zieba/Desktop/Data/GJ1214_Hubble13021/ibxy07paq_ima.fits
    current visit, orbit:  (0, 0)
    --- Looping over up-the-ramp-samples: 100%|██████████| 14/14 [00:00<00:00, 28.74it/s]


    ***************** Looping over files:   0%|          | 1/225 [00:00<02:53,  1.29it/s]
    Filename: /home/zieba/Desktop/Data/GJ1214_Hubble13021/ibxy07pbq_ima.fits
    current visit, orbit:  (0, 0)
    --- Looping over up-the-ramp-samples: 100%|██████████| 14/14 [00:00<00:00, 21.12it/s]


    ***************** Looping over files:   1%|          | 2/225 [00:01<03:05,  1.20it/s]
    Filename: /home/zieba/Desktop/Data/GJ1214_Hubble13021/ibxy07pcq_ima.fits
    current visit, orbit:  (0, 0)
    --- Looping over up-the-ramp-samples: 100%|██████████| 14/14 [00:00<00:00, 21.96it/s]


    ***************** Looping over files: 100%|█████████▉| 224/225 [03:43<00:00,  1.05it/s]
    Filename: /home/zieba/Desktop/Data/GJ1214_Hubble13021/ibxy10pmq_ima.fits
    current visit, orbit:  (2, 11)
    --- Looping over up-the-ramp-samples: 100%|██████████| 14/14 [00:00<00:00, 25.90it/s]


    ***************** Looping over files: 100%|██████████| 225/225 [03:44<00:00,  1.00it/s]
    Saving Metadata
    Finished s20
Stage 20 creates several output files inside:
stage20/s20_run_*/extracted_lc
Important files include:
lc_white.txt: broadband (“white”) light curvelc_spec.txt: extracted spectrum for every exposure and detector columndiagnostics.txt: extraction diagnostics such as number of rejected outliersbackground.txt: estimated background levels
Stage 20 also creates white-light-curve plots with uncertainties in:
stage20/s20_run_*/figs/s20_lightcurves
If multiple visits are present, PACMAN automatically generates:
one combined white light curve
one white light curve per visit
Stage 20 also saves a wavelength table for the white light curve:
stage20/s20_run_*/extracted_lc/wvl_table.dat
This file contains the central wavelength, half-width, and wavelength edges of the white-light bin. It is copied into Stage 30 when fitting the white light curve.
After Stage 20 we can either:
Continue with Stage 21 if the user wants to fit spectroscopic light curves.
Continue with Stage 30 to fit the broadband (“white”) light curve.